- i used python unittest to our based unittest framework
- python unittest
- check testsuite is pass/fail
- python nose
- call python unittest folder and testsuites
- python subprocess/multiprocess
- call system call (irun, vcs....)
- python re(regular expression)
- check simulation result is pass/faill if the error tokens are not found
- UVM testsuites
- define UVM test sequence for your simulator
- irun -uvm +UVM_TESTNAME="
"... - prepare your test sequence
- like xxSequences.sv
- test_1read_after_1write
- test_mread_after_mwrite
- test_read_write_at_same_time
- jenkins
- job manager
- daily regression run
2013年5月15日 星期三
python unittest + UVM testsuites + Jenkins = DUT regression
in recently, i got a order from my boss. he asked me to build up a automatically unittest env that can very quick to know where is the problem such as protocol error, functional error, timing error ... when the design is changed. the below list is my auto regression flow and requirements

2010年6月1日 星期二
BSDL 4 JTAG
BSDL
在做 JTAG Boundary-scan test中, 不可或缺的 file. 裡面會定義好 JTAG 的指令, 跟實際板子上的 pin map, 還有一些 Boundary scan register define.
Boundary-Scan Description Language (BSDL)
The Boundary-Scan Description Language (BSDL) is a subset of VHDL (VHSIC Hardware Description Language) that describes how boundary-scan (JTAG) is implemented in a device and how it operates. Boundary-scan tools usually require that the user supply BSDL files for the devices being used in order to properly generate test vectors and perform in-system programming and functional testing.
Ref from: http://www.corelis.com/support/BSDL.htm
BSDL file Format
- Entity descriptions
- Generic parameter
- Logical Port description
- Use statements
- Pin Mapping(s)
- Scan Port identification
- Instruction Register description
- Register Access description
- Boundary Register description
//- Entity descriptions
    entity S3C2416 is

//- Generic parameter
    generic (PHYSICAL_PIN_MAP: string:= "S3C2416_FBGA");

//- Logical Port  description
    port (
          PEXTCLK      : in       bit;
          PFRnB        : in       bit;
          PRDATA       : inout    bit_vector (0 to 15);
          GND0         : linkage  bit;
          PWR31        : linkage  bit;

//- Use statements
          use STD_1149_1_2001.all;
          attribute COMPONENT_CONFORMANCE of S3C2416: entity is "STD_1149_1_2001";

          attribute PIN_MAP of S3C2416: entity is PHYSICAL_PIN_MAP;

//- Pin Mapping(s)
          constant S3C2416_FBGA: PIN_MAP_STRING :=
            "PEXTCLK      : P15," &
            "PFRnB        : E3," &

//- Scan Port  identification
   attribute TAP_SCAN_CLOCK of PTCK  : signal is (1.000000e+06, BOTH);
   attribute TAP_SCAN_IN    of PTDI  : signal is true;
   attribute TAP_SCAN_MODE  of PTMS  : signal is true;
   attribute TAP_SCAN_OUT   of PTDO  : signal is true;
   attribute TAP_SCAN_RESET of PnTRST: signal is true;

//- Instruction Register description
   attribute INSTRUCTION_OPCODE of S3C2416: entity is
     "BYPASS  (1111)," &
     "EXTEST  (0000)," &
     "SAMPLE  (0011)," &
     "PRELOAD (0011)," &
     "IDCODE  (1110)";

//- Register  Access descript
   attribute REGISTER_ACCESS of S3C2416: entity is
        "BYPASS    (BYPASS)," &
        "BOUNDARY  (EXTEST, SAMPLE, PRELOAD)," &
        "DEVICE_ID (IDCODE)";

//- Boundary Register description
   attribute BOUNDARY_REGISTER of S3C2416: entity is
--
--    num   cell   port          function      safe  [ccell  disval  rslt]
--
     "684  (BC_1,  PnRSTOUT,     output2,      X),                        " &
     "683  (BC_4,  PEINT(8),     observe_only, X),                        " &
     "682  (BC_1,  *,            control,      0),                        " &
     "681  (BC_1,  PEINT(8),     output3,      X,    682,    0,      Z),  " &
Ref:
-- The following list specifies the characteristics of each cell in the boundary
-- scan register from TDI to TDO. The following is a description of the label
-- fields:
-- num : Is the cell number.
-- cell : Is the cell type as defined by the standard.
-- port : Is the design port name. Control cells do not have a port
-- name.
-- function: Is the function of the cell as defined by the standard. Is one
-- of input, output2, output3, bidir, control or controlr.
-- safe : Specifies the value that the BSR cell should be loaded with
-- for safe operation when the software might otherwise choose a
-- random value.
-- ccell : The control cell number. Specifies the control cell that
-- drives the output enable for this port.
-- disval : Specifies the value that is loaded into the control cell to
-- disable the output enable for the corresponding port.
-- rslt : Resulting state. Shows the state of the driver when it is
-- disabled.
Ref: http://boundaryscan.blogspot.com/
http://www.xilinx.com/support/answers/8350.htm
2010年4月23日 星期五
Eclipse CDT + OpenOCD + OpenJTAG
Eclipse CDT + OpenOCD + OpenJTAG for ARM Debug ENV
SoftWare:
IDE : Eclipse CDT
Debug: OpenOCD
GNU/ cross compiler(ARM)...
Ref:
OpenOCD : http://www.yagarto.de/index.html
Eclipse : http://www.eclipse.org/
安裝下載
YAGARTO GNU ARM toolchain,
YAGARTO Tools ,
Integrated Development Environment
請記得把 bin, include, lib 加入Windows 的path 中
Check all install is ok
% openocd -version
% arm-elf-gcc --version
%make -v
HardWare:
OpenJTAG
http://funningboy.blogspot.com/2010/04/openjtag.html
Design flow:Hardware
ID(4). openJTG (usb 2 JTAG)
Software
ID(1). OpenOCD : 為 ID(4)OpenJTAG(FTD2xx) Driver, name xxx.dll
ID(2). ARM-ELF-GDB (cross compiler), compile code 2 ARM Based Env
ID(3) IDE(Design Env)
TCP connect (Remote Debuge)
http://funningboy.blogspot.com/2010/02/gdb-debug.html

 透過OpenOCD Lib 轉成USB Protocol 的Series Data .
USB control
http://funningboy.blogspot.com/2010/03/usb-device.html
透過OpenOCD Lib 轉成USB Protocol 的Series Data .
USB control
http://funningboy.blogspot.com/2010/03/usb-device.html
 在OpenJTAG 內會把 Series Data Parse 成 Parallel Data, TDI, TDO, TMS....
JTAG methodology
http://funningboy.blogspot.com/2010/02/jtag.html
在OpenJTAG 內會把 Series Data Parse 成 Parallel Data, TDI, TDO, TMS....
JTAG methodology
http://funningboy.blogspot.com/2010/02/jtag.html
 All pic ref: Using Open Source Tools for AT91SAM7S
 OpenJTAG

OpenJTAG and JLink :
1. Env Support:
Same:
usb 2 JTAG or rs232 2 JTAG
Difference:
OpenJTAG : 可以用在Windows,Linux下.
JLink : 只能用在Windows下,
2.IDE Env:
OpenJTAG :
能用在所有支持GDB工具上, 比如IAR. Eclipse. winarm. 不能用在支持RDI的工具上.比如ADS。
JLink :
支持多種工具 RDI. GDB, 幾乎所有Windows下的工具都支持, 比如ADS. Keil MDK. IAR
3. Flash burn
OpenJTAG. JLink對FLASH的燒入差不多
Ref: http://www.openjtag.net/index.php?title=Main_Page
Ref: http://www.study-kit.com/list.asp?ProdId=0181
2010年3月15日 星期一
USB Device
- Pic Ref: http://www.geekalerts.com/usb-missile-launcher-with-webcam/
- 上圖是我在找Usb Driver時看到的Application,呵呵...不知道準不準就是.
- 拉回主題. 底下用Usb Lib來做到Remote Control or Device Configure. 可應用的範圍有 JTAG debug, Erase Flash..... 可參考 Print Port Control 2 JTAG control http://funningboy.blogspot.com/2010/02/print-port-control.html http://funningboy.blogspot.com/2010/02/jtag.html
- 準備工具
libusb-win32
http://libusb-win32.sourceforge.net/
安裝流程就請參考底下
download, 且安裝
libusb-win32-filter-bin-0.1.12.2.exe
底下有個測試程式,會幫你Detected 目前的Usb Device, Test Program
 下載測試檔
libusb-win32-device-bin-0.1.12.2.tar.gz
這邊會有compiler好的Dll, 跟Driver, 把bin/libusb0.dll 放到 windows/system32 底下,
libusb0.sys 放到 windows/system32/driver底下.
Cygwin + Mingw( cross compiler)
Cygwin為模擬Linux的環境, Mingw 為Windows 的 gcc/g++ compiler. 雖然Cygwin 內建有 gcc/g++ compiler,但是那個是針對Linux Based的.我們現在是用Cygwin 來模擬Linux環境, 實際再run的時候, 最底層的Protocl 還是Windows Based, Cygwin 只是個Wrapper用 DLL來溝通.
安裝流程
下載Cygwin (略過) 請記的環境變數 Path的部分要加入系統變數中
Default : /usr/local/bin:/usr/bin:/bin:/usr/X11R6/bin..
可鍵入
% echo $PATH
確定gcc / g++ version
% gcc -v
確保Mingw 的Path 有被安裝進去
Ref : http://www.mingw.org/wiki/FAQ
PS: 如果你要自己compiler 出DLL檔的話, 可以下載src 資料夾.
libusb-win32-src-0.1.12.2.tar.gz
解壓之後,把makefile內的 -mno-cygwin 拿掉, 雖然 -mno-cygwin 會告訴gcc/g++ 現在是用Mingw來當compiler, 但是我用這個指令時會fail. 之後就鍵入
%make
....
會產生 libusb0.dll, libusb0.sys ....
就我們之前用Binary安裝的檔案.
下載測試檔
libusb-win32-device-bin-0.1.12.2.tar.gz
這邊會有compiler好的Dll, 跟Driver, 把bin/libusb0.dll 放到 windows/system32 底下,
libusb0.sys 放到 windows/system32/driver底下.
Cygwin + Mingw( cross compiler)
Cygwin為模擬Linux的環境, Mingw 為Windows 的 gcc/g++ compiler. 雖然Cygwin 內建有 gcc/g++ compiler,但是那個是針對Linux Based的.我們現在是用Cygwin 來模擬Linux環境, 實際再run的時候, 最底層的Protocl 還是Windows Based, Cygwin 只是個Wrapper用 DLL來溝通.
安裝流程
下載Cygwin (略過) 請記的環境變數 Path的部分要加入系統變數中
Default : /usr/local/bin:/usr/bin:/bin:/usr/X11R6/bin..
可鍵入
% echo $PATH
確定gcc / g++ version
% gcc -v
確保Mingw 的Path 有被安裝進去
Ref : http://www.mingw.org/wiki/FAQ
PS: 如果你要自己compiler 出DLL檔的話, 可以下載src 資料夾.
libusb-win32-src-0.1.12.2.tar.gz
解壓之後,把makefile內的 -mno-cygwin 拿掉, 雖然 -mno-cygwin 會告訴gcc/g++ 現在是用Mingw來當compiler, 但是我用這個指令時會fail. 之後就鍵入
%make
....
會產生 libusb0.dll, libusb0.sys ....
就我們之前用Binary安裝的檔案.
- 結果 在libusb-win32-src-0.1.12.2底下有個tests的資料夾,用裡面的sample當例子 鍵入 %gcc -O2 -Wall -o DLSPD.exe -I./src testlibusb.c -s -L. -lusb -lgdi32 -luser32 -lcfgmgr32 -lsetupapi -lcomctl32

 最後就是要K API摟....
Ref: http://dannynote.blogspot.com/2008/11/linuxlibusblibrarylinuxusbkernel-device.html
http://realchecko.blogspot.com/2009/04/build-openocd-under-mingw-with-ftd2232.html
最後就是要K API摟....
Ref: http://dannynote.blogspot.com/2008/11/linuxlibusblibrarylinuxusbkernel-device.html
http://realchecko.blogspot.com/2009/04/build-openocd-under-mingw-with-ftd2232.html
2010年2月24日 星期三
JTAG
- JTAG(Joint Test Action Group),利用邊界掃描的方式,依序的做Shift and Capture for each test Vector,即可對HardWare內部的Flip-Flop做Debug的動作.
優點: 簡單,不需要用到Probe的方式,可針對內部的Scan-Flip-Flop.
缺點: Boundary Scan Length/Scan Length過大時,會降低Debug的效能.
Pin Assignment
TDI (Test Data In)
TDO (Test Data Out)
TCK (Test Clock)
TMS (Test Mode Select)
TRST (Test Reset) optional
利用TDI/TDO的 I/O端口做Vector的輸入跟輸出, Test Vector in(TDI), Result out(TDO),
TMS為FSM Mode Select, TCK為Trigger Clock, TRST 為系統Reset.
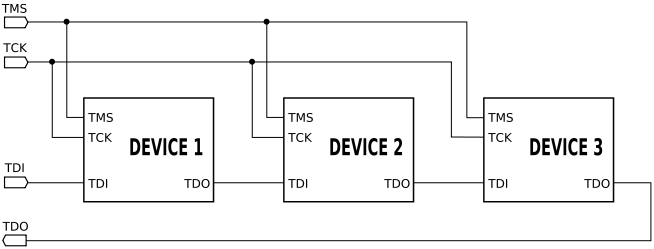 Ref: http://en.wikipedia.org/wiki/Joint_Test_Action_Group
 利用FSM來判斷status,Mode select先選 Instruction Mode決定HardWare 內部要做怎樣的Mode,如現在是JTAG Debug Mode or Function Mode...等Mode 決定好時, 在下個Clock切換到Data Mode,開始打我們所要的Pattern,在此同時TDO會收到上一筆我們所要測的Result.
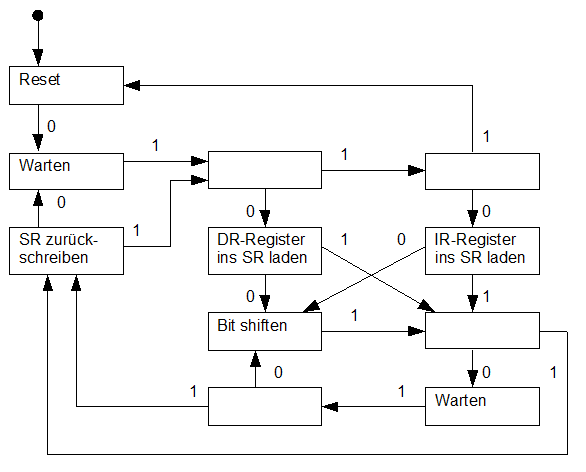 Ref: http://en.wikipedia.org/wiki/Joint_Test_Action_Group
- 如果對JTAG Debug 有興趣的人,可以參考 http://urjtag.org/ 這裡面有已經開發好的Driver跟Debug,不過限制只有他內部提供的Board跟Cable有效.如果不是的,可能要自寫個Interface2Interface的Converter.
GDB Debug
- 在Embedded系統上常被用到的就是GDB Debug的機制,透過Remote control 設定 break point or print register status...
底下是目前最常看到的Debug平台,透過PC 端compiler好 Target(ARM)端的執行檔(.EXE),在藉由JTAG燒入到Target上,最後透過GDB Remote Debug的方式,設定Break Point or Dump Register的方法,達到Realtime Debug.

- 這邊我們簡化流程,把Target端跟Host端都在我們的PC上來模擬Embedded Debug的流程. Step 1. 安裝GDB Debug http://www.gnu.org/software/gdb/ 安裝參考 http://www.zychip.com/html/support/linux_gdb/index.php 這邊要注意,因為我們不須代入ARM-Linux的compiler.只要鍵入安裝路徑就可 % cd gdb-7.0.1 % ./configure --prefix=/usr/local/bin % make % make install PS: 切記路徑必須要在Path中,這樣才能被呼叫. Step 2. check /usr/local/bin/ 內有 gdb.exe, gdbserver.exe check GDB 安裝完成 % gdb 看使否會進GDB 的 console Step 3. sample code && Debug hello.c

 程式碼下載
http://sites.google.com/site/funningboy/perl_code/hello.c?attredirects=0&d=1
Step 4. 模擬Target 端
% gcc -g -O0 -o hello.gdb hello.c
% cp hello.gdb hello
% strip -s hello
這邊藉由gcc complie出我們要模擬的Target端,Post的部分我們就省略了.
要模擬Traget的部分要靠 gdbsever的功能,請鍵入
% gdbserver :3333 hello
程式碼下載
http://sites.google.com/site/funningboy/perl_code/hello.c?attredirects=0&d=1
Step 4. 模擬Target 端
% gcc -g -O0 -o hello.gdb hello.c
% cp hello.gdb hello
% strip -s hello
這邊藉由gcc complie出我們要模擬的Target端,Post的部分我們就省略了.
要模擬Traget的部分要靠 gdbsever的功能,請鍵入
% gdbserver :3333 hello
- 會模擬在Target端是由port 3333來連線,且運行hello

- Step 4 模擬PC連到 Target 端
請在開個新的console,鍵入
% gdb

執行結果
 Reference links
2010年2月21日 星期日
print port control
- 在嵌入式的系統架構下,如何把data燒入到target board(ARM,embedded...)上,不外乎透過ARM 的 multi ice/ADS,而這些傳輸的動作,必須要用到cable線來連接target(board) and host(PC),以下我們就用最簡單的方式透過print port 打出我們所要的vector. "Wiggler" 為目前最為廣泛應用的cable線,因為便宜且製作方便,材料器材都可在電子材料行買到,詳細資料可以在此找到 http://blog.xuite.net/kyanite0909/techshare/15457382 http://www.frozeneskimo.com/electronics/arm-tutorials/jtag-wiggler-clone/
- 我們在這邊主要是介紹如何藉由 "Perl" 呼叫 Windows 的 DLL,透過Driver control的方式把vector打出去,首先要Perl模擬環境,目前我是用active perl 當我的environment, 因為active perl 可以安裝在Windows上,且ppm套件可以從cpan下載 . http://www.activestate.com/activeperl/ 安裝流程請上網查詢
- 假設已經有了perl的模擬環境,現在就必須透過cpan的連線下載perl的model套件, 進入command line % % cpan % get Device::ParallelPort::Printer % exit 在 /c/Perl/cpan/build/內會看到你下載好的model,在鍵入以下的command % cd /c/Perl/cpan/build/Device-ParallelPort-1.00 % perl Makefile.pl % make test % make install PS: 如果你是用windows的command line下,請先下載專為DOS nmake,在把make的command改成nmake . http://msdn.microsoft.com/zh-tw/library/dd9y37ha(VS.80).aspx 不然就請先下載好cygwin的Linux模擬環境. http://www.cygwin.com/ 如果以上步驟都ok了,可以在command line下鍵入 % perl -e 'use Device::ParallelPort::Printer;' 來確保model已經安裝完成.
- 再來請到http://logix4u.net/Legacy_Ports/Parallel_Port/Inpout32.dll_for_Windows_98/2000/NT/XP.html
安裝我們所需要的DLL driver檔 "Inpout32.dll".
請放到Windows\sytem32的資料夾底下.
底下來簡略介紹一我們要如何控制 "Inpout32.dll" 的input/output的接口,首先要確定我們的print port的硬體driver是否已安裝好.
可以到 控自台->系統-> 進階 -> 硬體 -> 裝置管理員 check 一下 bios 要driver print port時所要用到的address 區段,一般是用"LPT1" address為 "0x378" 這個記憶體區段
http://logix4u.net/Legacy_Ports/Parallel_Port/How_to_read_Parallel_Serial_Port_address_from_BIOS.html
在第一個框框我們已經確定好我們的address區段後,在第二個框框我會check我們的DLL是否可以被呼叫起來.
利用Win32的API做input,output的接口測試,以這段為例子Win32::API->new("inpout32", "Inp32", ['I'], 'I'); 會create一個new的ptr,後面依序接的是DLL的name,DLL下的call func,再來是input,output的接口.這邊必須要注意到parallel port是用byte作傳輸,一次8個bit.如果只是單純對一個bit而言,可以用MSB LSB的方式,定義好所要傳的格式,把騎他的bit填成o/1.


訂閱:
文章 (Atom)