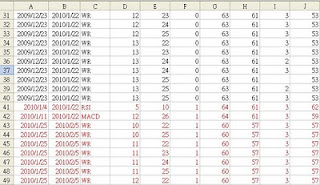
- 這是我突然想到的測試方式,藉由這次的大盤下跌,測試技術指標是否能夠優先避開下跌的波段,等頭部確定後再做回補的動作.
- 前提: 利用GA Algorithm 做出每個技術指標的進出時間點 可以參考底下我做過的Research http://funningboy.blogspot.com/2010/02/trading-performance-v1.html http://funningboy.blogspot.com/2010/02/trading-performance-v2.html 假設: Case 4 2303.TW Simulation Test Time : 2010/03/08 (T-50) Constrain : Initial Poluation =30; End Poluation Size =500; End Generation =10; Limit Fitness =2; MutationRate =0.1; PS : 內部加入 Time Windows && Profit Filter, KD, RSI, MACD, WR, DMI, OBV, VR, SAR, BIAS. Time Windows http://funningboy.blogspot.com/2010/03/time-windows.html 初始產生30組基因解,且收斂範圍為10個世代 or Poluation大小到達500組,每組基因至 少要獲利2,且變異機率為0.1. Entry Rule: 我們會建立每個技術指標的 Fast , Slow 線,藉由Fast 跟 Slow的交叉做逼近的動作,找出 進場出場位置,在這就不詳述了. 假設KD進出場策略,請參考底下 http://funningboy.blogspot.com/2010/02/trading-performance-v1.html
- Rst 表格欄位依序為 EntryTime,LeaveTime,Indicator,FastLength,SlowLength,Buy/Sell,EntryPrice,LeavePrice ,Profit,LifeTime PS: Buy/Sell 0/1 發現再大跌時我們會翻空手,且還有 ">" 2 的獲利情形,之後到2010/02/04時又轉回多手的狀態.可以做多也可以做空.
 結論: 發現在WR, OLB, BIAS 對2330.TW 的進出有良好的績效,且WR 在多轉空,空轉多
時也能維持良好的獲利.
PS: 我個人認為每檔股票都有其相對應的技術指標,就像操作原油,黃金....,每樣商
品都有其特殊的地方. 如何發現商品的特性,不外藉由不斷的測試跟Time
Moving,找每一季所對應的symptom...
Rst Download: http://sites.google.com/site/funningboy/stock_data/2010_02_2303_Ga_Rst.xls?attredirects=0&d=1
http://sites.google.com/site/funningboy/stock_data/2010_02_2303_Ga_Rst?attredirects=0&d=1

沒有留言:
張貼留言